
Ask what a learning platform measures and you will usually get a list: completions, scores, time spent, maybe a satisfaction rating. Ask what it should measure and the conversation changes, because the answer depends on what the learning experience asks people to do. This guide is for the instructional designer deciding what a scenario-based program should capture and why. Its companion guide, Measuring Behavior Change, covers how to frame that data as evidence within Kirkpatrick's and Moore's outcome frameworks; this one covers the design side, which signals to instrument before the program ships.
Why do analytics have to be designed in, not bolted on?
There is a hard constraint underneath every analytics conversation: you can only measure signals the experience generates. No dashboard, learning record store, or analysis technique can recover data the learner was never asked to produce.
A content module followed by a quiz generates two signals: exposure and recall. Everything downstream of that, every report, every chart, is a rearrangement of exposure and recall. If a stakeholder later asks whether learners can make better decisions, the data cannot answer, because no decisions were ever made.
A scenario-based program generates a different signal entirely. When a learner faces a realistic situation and chooses a course of action, that choice is an observable act of judgment. String enough of those choices together, under conditions that make them comparable, and you have a dataset that describes how a cohort decides and how that changes.
This means the analytics plan is a design-phase decision, not a reporting-phase one. The questions you want answered at the end (Where did learners start? Did they improve? Who needs more help?) dictate what the experience must ask learners to do at the beginning. Decide the signals first, then design the scenarios that produce them.
Which signals should a scenario-based program capture?
Six signals cover what a well-instrumented program needs. The first three carry the evidentiary weight; the next two add diagnostic depth; the last one is bookkeeping.
| Signal | What it tells you | Example use |
|---|---|---|
| First choices before feedback | The true baseline: where the cohort actually starts | Justify the program; make later gains interpretable |
| Response to mentoring | Who recognized the optimal approach after coaching, and how quickly | Separate first-try competence from coached competence |
| Change across comparable situations | The competence trajectory over the program | Demonstrate the program itself moved the number |
| Preference among valid options | Which defensible option each group favors | Surface unexpected patterns worth new education |
| Segment breakdowns | Where different audiences struggle differently | Target follow-up by role, specialty, or experience |
| Continuation and completion | Engagement with the experience, nothing more | Assess whether learners choose to keep going |
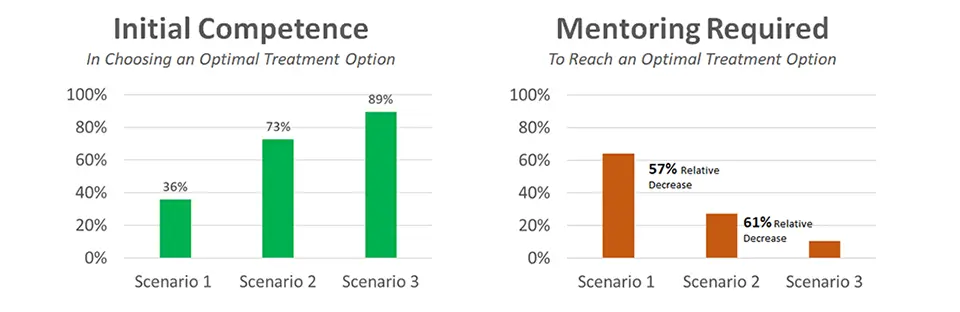
1. First choices, before any feedback. The single most valuable data point in a scenario-based program is what each learner chose first, before the experience gave them any signal about which options were better. This is the true baseline, and it routinely surprises program teams. In a published continuing medical education (CME) activity on severe atopic dermatitis, only 36% of learner decisions in the first clinical situation matched an option the expert faculty had designated as optimal (Seifert, 2021). That number was not a failure. It was the real starting point that no needs assessment or pre-test had surfaced, and it became the denominator for everything the program later claimed.
2. Response to mentoring. Corrective mentoring at the decision point is simultaneously instruction and measurement, an argument Measuring Behavior Change develops in full; the design question here is what to record when it fires. Two fields matter: the location of the correction (which situation, which decision, which option) and the learner's choice after it. Capturing what learners chose after mentoring distinguishes two populations that a score alone would merge: learners who were competent on the first try, and learners who became competent once an expert explained the reasoning. Both end the scenario making good choices. Only the data tells you which path they took, and that distinction is what makes the analytics diagnostic rather than merely evaluative.
3. Change across comparable situations. A baseline is a snapshot; a program needs a trajectory. When learners work through several comparable situations in sequence, the shift in first-choice accuracy from the first situation to the last is a before-and-after measure taken on behavior. The atopic dermatitis activity showed the pattern clearly: initial competence rose from 36% in the first situation to 73% in the second and 89% in the third, while the corrective mentoring required fell by 57% and then a further 61% (Seifert, 2021). Rising first-try competence and falling mentoring demand, moving together across situations, is the signature of a program that worked. A companion program in chronic lymphocytic leukemia showed initial competence increasing fourfold across three situations on one practice gap. Neither result would exist if the programs had posed each decision only once.
4. Preference among multiple valid options. Real decisions rarely have one right answer, and well-designed scenarios reflect that by including several defensible options at a decision point. Capturing which valid option learners choose first yields a signal no assessment produces: the cohort's actual preferences. The atopic dermatitis dataset, for example, reported which of the optimal therapeutic options clinicians reached for first (Seifert, 2021). Preference data earns its place when it surprises you. If a large share of a cohort consistently favors an older option over a newer one the faculty considers equally valid, that is not an error to correct; it is a finding, and often the seed of the next educational program.
5. Segmentation. Decision data becomes far more actionable when it can be broken down by who made the decision: role, specialty, experience level, region, or business unit. A cohort-level competence gain can hide a subgroup that never improved, and an aggregate preference can mask two groups with opposite habits. The decision data behind the published CME programs could be broken down by professional designation, specialty, and experience level, which is what turns a single report into a set of targeted follow-up actions: this audience needs more support on this decision, that one does not.
6. Engagement signals, labeled as engagement. Continuation rates, completion rates, and voluntary progression to optional scenarios are worth capturing. They tell you whether the experience holds attention, which matters for any program that depends on learners choosing to keep going. The design obligation is labeling: engagement data describes the experience, not the learner's competence. A 90% completion rate is a fact about the program's appeal. It is not evidence anyone decides differently, and reporting it in the same breath as competence data invites stakeholders to conflate the two.
What makes decision data comparable across learners?
All six signals rest on one precondition: every learner must face the same expert-designed situations and the same decision points. Comparability is what turns choices into analytics.
If each learner wanders a different conversational path, encounters different framings of the problem, or can avoid a decision entirely, the dataset loses its common denominator. Two learners' records then describe two different tests, and nothing cohort-level can be computed across them: no baseline, no trajectory, no preference counts, no segment breakdowns. Each individual transcript may still be rich and worth reading, but the aggregate questions the analytics exist to answer become unanswerable.
This is a genuine design tradeoff, and it deserves to be made consciously. Fully open-ended experiences maximize learner freedom and generate rich individual transcripts, but they trade away cohort-level measurement. Structured scenarios, where experts define the situations, the decision points, and the option sets in advance, constrain the space of paths precisely so that every learner's choices land in the same frame. If decision-level analytics are a program requirement, structure is not a limitation to apologize for. It is the instrument.
What should you not bother collecting?
Instrumentation has a failure mode in both directions. Programs that capture too little cannot answer the behavior question; programs that capture everything bury the answer in noise. Three categories earn skepticism:
- Time-on-page and other duration metrics. Time spent measures time spent. A learner who lingers may be engrossed, confused, or answering email. Unless a specific design hypothesis depends on duration, it adds volume without adding meaning.
- Vanity counts. Logins, page views, click totals, and streaks make dashboards look busy and reports look rigorous. None of them describes a decision. If a metric would look identical whether or not anyone learned anything, it does not belong in an outcomes report.
- Unanchored interaction data. Capturing every click without tying events to defined decision points produces a large dataset with no schema for meaning. The value of a recorded choice comes from what it is a choice between, which is exactly the information expert design supplies and raw event logging does not.
The discipline is to work backward from the report you owe your stakeholders. Every field you collect should map to a question someone will actually ask.
How should you report what you capture?
Reporting is where good instrumentation is most often squandered, so three habits are worth building in from the start.
Lead with decisions and change. The headline of a scenario-based program's report is the trajectory: where first-choice competence started, where it ended, and how much corrective mentoring the cohort needed along the way. That is the evidence stakeholders funded the program to produce.
Keep engagement in its lane. Report continuation and completion, clearly labeled as engagement, in their own section. High engagement strengthens the story (learners chose to keep going), but it supports the competence evidence rather than substituting for it.
Report surprises as findings. Preference patterns and segment gaps are not blemishes to smooth over. "Experienced clinicians preferred option A while newer clinicians split between A and C" is exactly the kind of sentence that makes a program report worth reading, and it points directly at what to do next.
Platforms built around this measurement model make the reporting side considerably easier. In AliveSim's Guided Scenarios, the signals described in this guide arrive pre-instrumented: because every learner faces the same designed decisions, first choices, responses to just-in-time mentoring, and change across situations land as comparable decision-level records without extra tagging. The resulting data still sorts the way this guide argues it should: the decision-level records belong in the competence column, and continuation or completion stays labeled as engagement, exactly the discipline AliveSim is built to enforce.
How does this data improve the program itself?
The final reason to instrument these signals is that they feed the program's own evolution, not just its evaluation.
If the mentoring fields described under Signal 2 are recorded consistently (where each correction occurred, what was chosen before it, what was chosen after), the aggregate becomes a revision map. It shows which presentations of the problem still demand heavy mentoring after the program has run, which gaps closed quickly, and which never fully closed. That map answers the program team's next-cycle questions directly: which scenarios need revision, which decisions need stronger mentoring dialogue, and which persistent gaps justify an entirely new program. The published CME datasets showed exactly this: where additional educational interventions were needed (Seifert, 2021).
Preference data plays the same forward-looking role. When the analytics reveal that a cohort systematically overlooks a valid option, perhaps a newer approach they have not yet incorporated, that discovery defines the learning objective for the next program before anyone has to guess.
This is the quiet payoff of designing analytics into the experience: the same signals that prove the program worked also tell you what to build next. Measurement stops being a report you produce at the end and becomes the loop that makes each iteration of the program better than the last.
References
- Seifert, D. (2021). Incorporating skill development in CME via corrective mentoring. Alliance for Continuing Education in the Health Professions Almanac.
Related questions
What is decision-level data in learning?
Decision-level data is a record of the specific choices each learner made at each decision point in a learning experience: which option they selected first, whether that option was one the program's experts designated as optimal, what feedback they received, and what they chose after that feedback. It differs from activity data (enrollments, completions, time spent) because it captures judgment rather than attendance. Because each record is tied to a specific situation and a specific set of options, decision-level data can be aggregated across a cohort to show where learners start, where they struggle, and how their choices change over the course of a program.
What learning metrics matter beyond completion?
Completion confirms participation and nothing else. The metrics that matter beyond it are the ones tied to what learners do: the share of first choices that were optimal before any feedback (baseline competence), the change in that share across comparable situations (competence trajectory), the frequency and location of corrective feedback (where gaps concentrate), and breakdowns of all of these by role or experience level (where to target the next intervention). Satisfaction and confidence ratings remain useful context, and engagement measures like voluntary continuation are worth tracking, but only decision-based metrics answer whether the program changed how people choose.
How do you baseline learner competence?
Capture each learner's first choice at each decision point before any feedback, hints, or mentoring are delivered. The share of those first choices that match what experts designated as optimal is the cohort's baseline: a measure of where learners start, taken inside a realistic situation rather than on a quiz. For the baseline to be meaningful, every learner must face the same situations and the same options, and the first choice must be recorded before the experience reveals anything about which options are preferred. Published scenario-based programs have recorded baselines as low as 36% optimal first choices, which is exactly the kind of number that justifies the education and makes later gains interpretable.
Published January 20, 2026 · Updated July 14, 2026 · 10 min read